July Meta Update - Faction Performance Visualised!
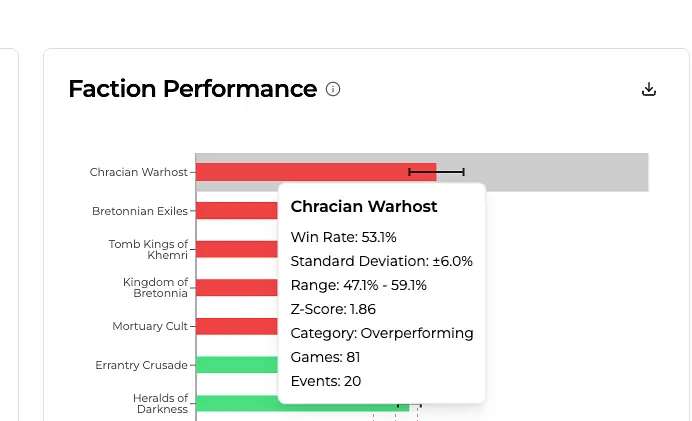
A new Faction Performance chart uses z-scores and standard deviations to show statistically significant over- and under-performance, plus PNG chart export.
Shipped July 8, 2025
We've just dropped a brand new Faction Performance chart to help you dive deeper into how each army is performing in tournaments.
Why This Chart Matters
This isn't just another win-rate bar chart. We teamed up with Malign Musings to bring you something that better reflects true over- and under-performance in the meta.
Instead of raw win rates alone, we now use z-scores and standard deviations to show statistically significant performance, so you can see which factions are really pulling ahead (or falling behind) the pack.
How it works
Each faction's win rate is compared to the average (mean) across all factions, and then categorized based on how far they deviate:
- Balanced (Green): Performing within 1 standard deviation of the mean.
- Outliers (Red): Over or underperforming beyond 1 SD.
- Extreme Outliers (Dark Red): More than 2 SD from the mean.
You'll also see error bars representing each faction's performance variance, how stable or swingy their results have been.
Exportable Charts!
Want to share a spicy stat or bring receipts to your next group chat? You can now export all our charts individually to PNG, perfect for discussions, debates, or social media posts.
Was this article helpful?
Related articles
Team tournaments, fully supported
Pairs, doubles, and full team events now have first-class support, from TO pairing to team score caps to combined sta...
What's NewPersonalize Your Profile with Custom Avatars!
Upload a custom profile picture, use Gravatar, or keep it simple with initials on Old World Rankings.
What's NewSecondary scoring, fully flexible
Secondary objectives are now built into scoring end to end, with official scenario templates, custom objectives, and ...
What's NewFaction Stats: Faster, Smarter, and More Powerful
Faction Stats got a rebuilt data foundation for faster loads, multi-faction comparison, and a new renegades filter.